

References:

P. Héas, E. Mémin, D.Heitz, P.D. Mininni. Power laws and inverse motion modeling: application to turbulence measurements from satellite images. Tellus Series A: Dynamic Meteorology and Oceanography, 64, 10962, DOI: 10.3402/tellusa.v64i0.10962, 2012 .


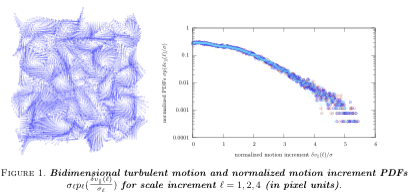
Bidimensional turbulence image sequence. Simulated particle images (right), true (middle) and estimated (left) velocity field with ~[Baker07] color system for scalar visualization of vector fields.
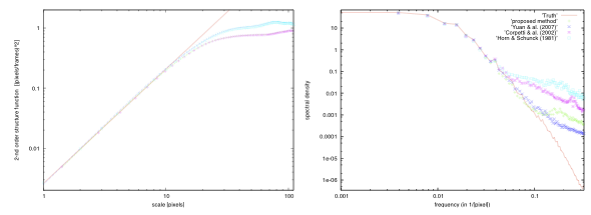
Power law model selection. Left : Inferred power law (continuous red line) for 2-nd order structure function. True (dash line) and estimated (crosses) 2-nd order structure functions in horizontal-vertical (in blue and turquoise) and diagonal (in pink and green) directions . Right : Energy spectra E(k) of first order (in turquoise), div-curl (in blue or pink) and self-similar (in green) regularizers compared to the true (in red) spectrum.
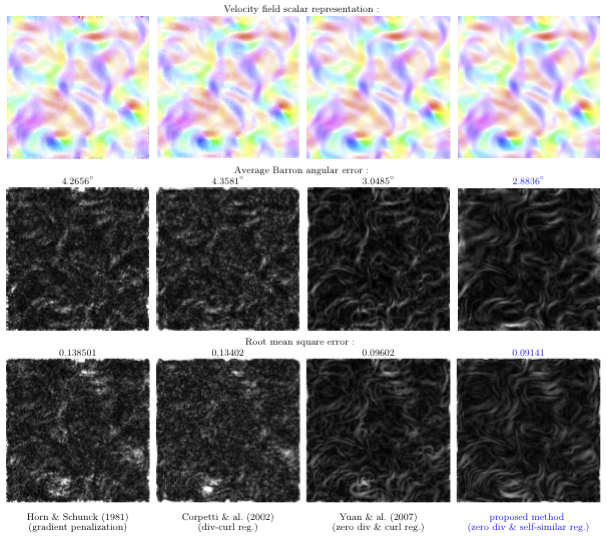
Motion estimation accuracy. Velocity field scalar representation (1-st line), Barron's angular error (2-nd line) and end point errors (3-rd line) comparisons with state of the art estimators. RMSE and average Barron angular error are displayed above the figures.

Input meteorological images. Sparse pressure difference maps of layers at intermediate altitude. White pixels of image are areas with no observations. The images characterize the layers evolution in a time interval of 15 minutes.

Horizontal winds & energy flux. Vector (left) and color (right) motion representations for increasing energy flux (including the most likely flux (in blue) selected by Bayesian inference superimposed on the sparse image data.
