
High resolution multispectral satellite image sequence (SPOT)
During the last decades, satellites have acquired incessantly high resolution images of many Earth observation sites. New products have arisen from this intensive acquisition
process : high resolution Satellite Image Time-Series (SITS).
They represent a large data volume with a rich information content and may open a broad range of new applications. This article presents an information mining concept which enables a user to learn and retrieve spatio-temporal structures in SITS. The concept is based on a hierarchical Bayesian modeling of SITS information content which enables us to link the interest of a user to specific spatio-temporal structures. The hierarchy is composed of two inference steps : an unsupervised modeling of dynamic clusters resulting in a graph of trajectories, and an interactive learning procedure based on graphs which leads to the semantic labeling of spatio-temporal structures. Experiments performed on a SPOT image time-series demonstrate the concept capabilities.
References:

P. Héas, M. Datcu, Supervised learning on graphs of spatio-temporal similarity in satellite image sequences, INRIA research report - 6299, 2007.
Software:
Source code and documentation, KEO ESA research project, 2005. "download"

Image sequence and feature space evolution. Spot multispectral image time series and scatterogramme of the infra-red and red channel.


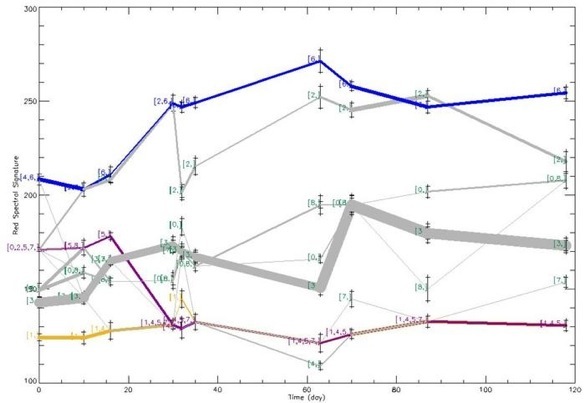
Example of trajectories of classes & clusters. Horizontal axis represents time. Above on the left: spatial evolutions of 9 classes (one class on each line). below on the left: correspondence with the original time-series. On the right :correspondence with the graph of cluster trajectories (vertical axis represent red radiometric values).

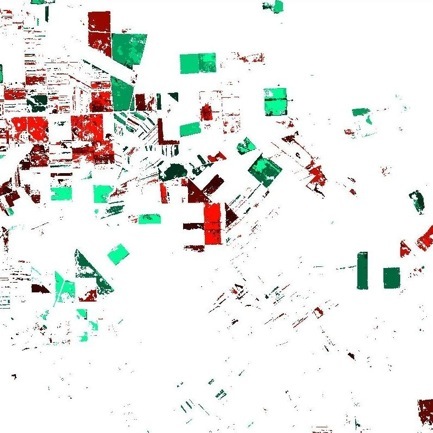
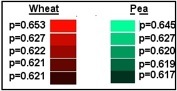
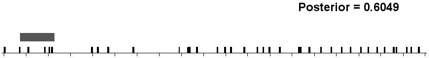
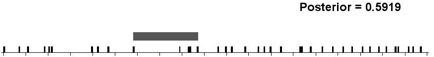
Learning of farming practice similarity. Crops of wheat or peas related to particular farming practices were probabilistically retrieved in space by learning spatio-temporal similarity with one pattern example. For both farming practices (wheat or pea), retrieved spatial classes are displayed with shaded colors (red or green) according to their posterior probabilities P appearing in the caption on the right.


Retrieval of ploughing phenomena by training with one positive and one negative example. Above: Positive example in yellow and negative example in red of the ploughing phenomenon. Below: probabilistic retrieval of similar spatio-temporal structures in time and space.